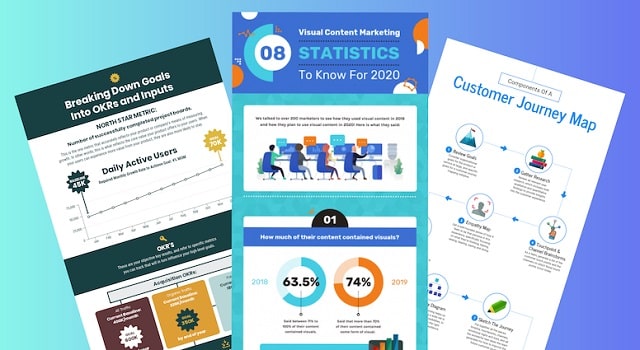
Want to boost your business marketing ROI along with advertising and branding? Diagrams are a great way to simplify complex information and make it more easily understood. They can also be used to help illustrate a point or convey a message in a visually appealing way. In fact, diagrams are so versatile that they can be used in a variety of marketing contexts, from website design to print ads to social media posts. Often times a picture is worth a thousand words, and a professionally designed diagram could be worth even more for your marketing.
Here are 13 ingenious ways to use diagrams in your marketing:
1. Navigation
Many websites use diagrams to help illustrate their navigation structure. This can be useful for users who are new to the site, as it gives them an idea of where they can go and how they can get there.
2. Processes
Process diagrams are a great way to illustrate the sequence of procedures in an easy-to-understand format. It helps simplify steps, especially when it comes to technical topics and complex procedures.
3. Product Instructions
Valuable diagrams can be used to help users understand how to use your product, making it easier for them to get started and become comfortable with your offering quickly.
4. How-To Guides
Use diagrams to create a series of how-to guides that users can follow for various procedures. Valuable content like this is perfect for getting your users started with your product and building a reputation as a thought leader.
5. Tutorials
Tutorials are another great way to help get your user started with your product. They can walk users through the basics of how to use your product, from setting it up to using its features. This valuable content can help improve the user experience and increase customer satisfaction.
6. Illustrate Ideas
In marketing articles and blog posts, diagrams can be used to illustrate abstract concepts in a visually appealing way. This can help make the content more engaging and easier to understand for readers. Additionally, diagrams can be a valuable tool for helping to communicate ideas quickly and clearly.
7. Lifestyle Diagrams
Lifestyle diagrams provide an illustration of someone's life or lifestyle mapped out in chronological order. They can be used to demonstrate another point about your product or industry, or they can be used to illustrate a point about your target customer.
8. Timelines
Timeline diagrams show events or activities over time. They are particularly helpful for illustrating historical concepts, but they can also be used to demonstrate trends in your industry or market.
9. Process Diagrams
Process diagrams show the steps involved in how something is done. These are valuable diagrams that can be used to help illustrate various procedures or processes in your product or industry, making them a valuable addition to any article or blog post.
10. Flowcharts
Flowcharts in project management streamline communication and understanding of complex processes. By visualizing steps and sequences, teams can quickly identify dependencies and bottlenecks, ensuring more efficient planning and execution. Incorporating flowcharts also aids in identifying redundant steps and potential improvements, promoting continuous optimization of workflows.
As a universally understood tool, they also bridge communication gaps across diverse teams, ensuring everyone is aligned with the project objectives and current status. To make a flowchart online, various tools offer user-friendly interfaces for quick and precise diagram creation. Make a flowchart online to leverage these benefits and enhance project outcomes!
11. Cycle Diagrams
Cycle diagrams illustrate how products are used over time. They can be helpful at demonstrating the product's lifecycle, as well as its value to customers over time. This type of diagram format is particularly useful when discussing your brand or company voice.
12. Gantt Charts
Gantt charts illustrate the tasks involved in completing a single objective over time. They are helpful for illustrating the sequence of events and showing their relationship to each other. Master the Gantt chart and your marketing will be much more organized.
13. Decision Trees
Decision trees can be used to help users make decisions by mapping out all available options and helping them understand the pros and cons of each choice. One way to make cool diagrams is to use Venngage — a free infographic maker that offers creative diagram templates for everyone.
Conclusion
These are just a few examples of how diagrams can be used in marketing content to help illustrate ideas quickly and clearly. Using these diagram types can also help improve readability, which is always an important consideration for marketers. If you are having a hard time making your own diagram from scratch, use an online diagram maker like Venngage. To start with creating marketing diagrams, click here.
